
The Sabodala-Massawa mine is one of Endeavour’s cornerstone assets and recently underwent an expansion which will elevate it to top-tier status.
Key stats
274 koz
2025 Production
~$1,250/oz
2025 AISC1
260 koz – 305 koz
2026 Production guidance
$1,350/oz – $1,550/oz
2026 AISC1 guidance
1. This is an alternative performance measure (non-GAAP measure). Please refer to the Alternative Performance Measures sections in our Annual Reports Financial Reviews for definitions and reconciliations of alternative performance measures to IFRS
Sabodala-Massawa mine
Sabodala-Massawa is the largest producing gold mine in Senegal and has been in operation for over a decade. The mine was acquired as part of Endeavour’s acquisition of Teranga in February 2021.
Endeavour has expanded the Sabodala-Massawa mine with the addition of a new BIOX processing facility. The new processing facility adds incremental production of 1.35Moz at a low AISC of $576/oz over its mine life. First gold was poured at the BIOX processing facility on 18 April 2024.
Gallery


CIL plant


First gold from the BIOX expansion with VP Operations Lawrence Manjengwa


Power station expansion to meet demand from two plants


Solar plant in construction


Providing access to electricity for 10 local villages


Supporting female agricultural cooperatives
Sabodala-Massawa mine
Key facts
Ownership
90% EDV, 10% Government of Senegal
Mining method
Open Pit/Owner Mining Processing
Production start date
2009
Processing technology
CIL Plant and BIOX
Expected mine life
+16 years
Workforce
~1,620
Location


Timeline
Exploration potential
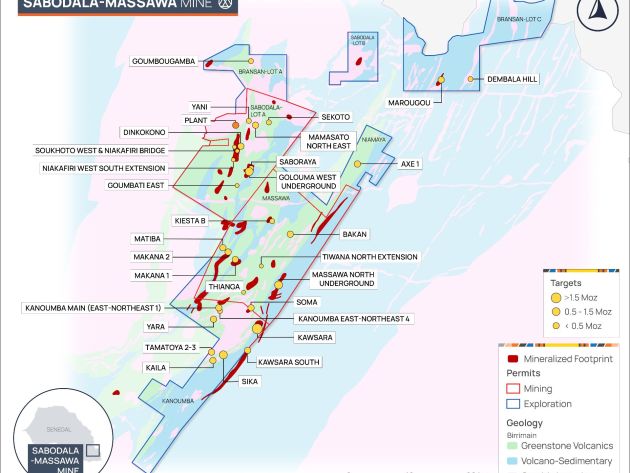
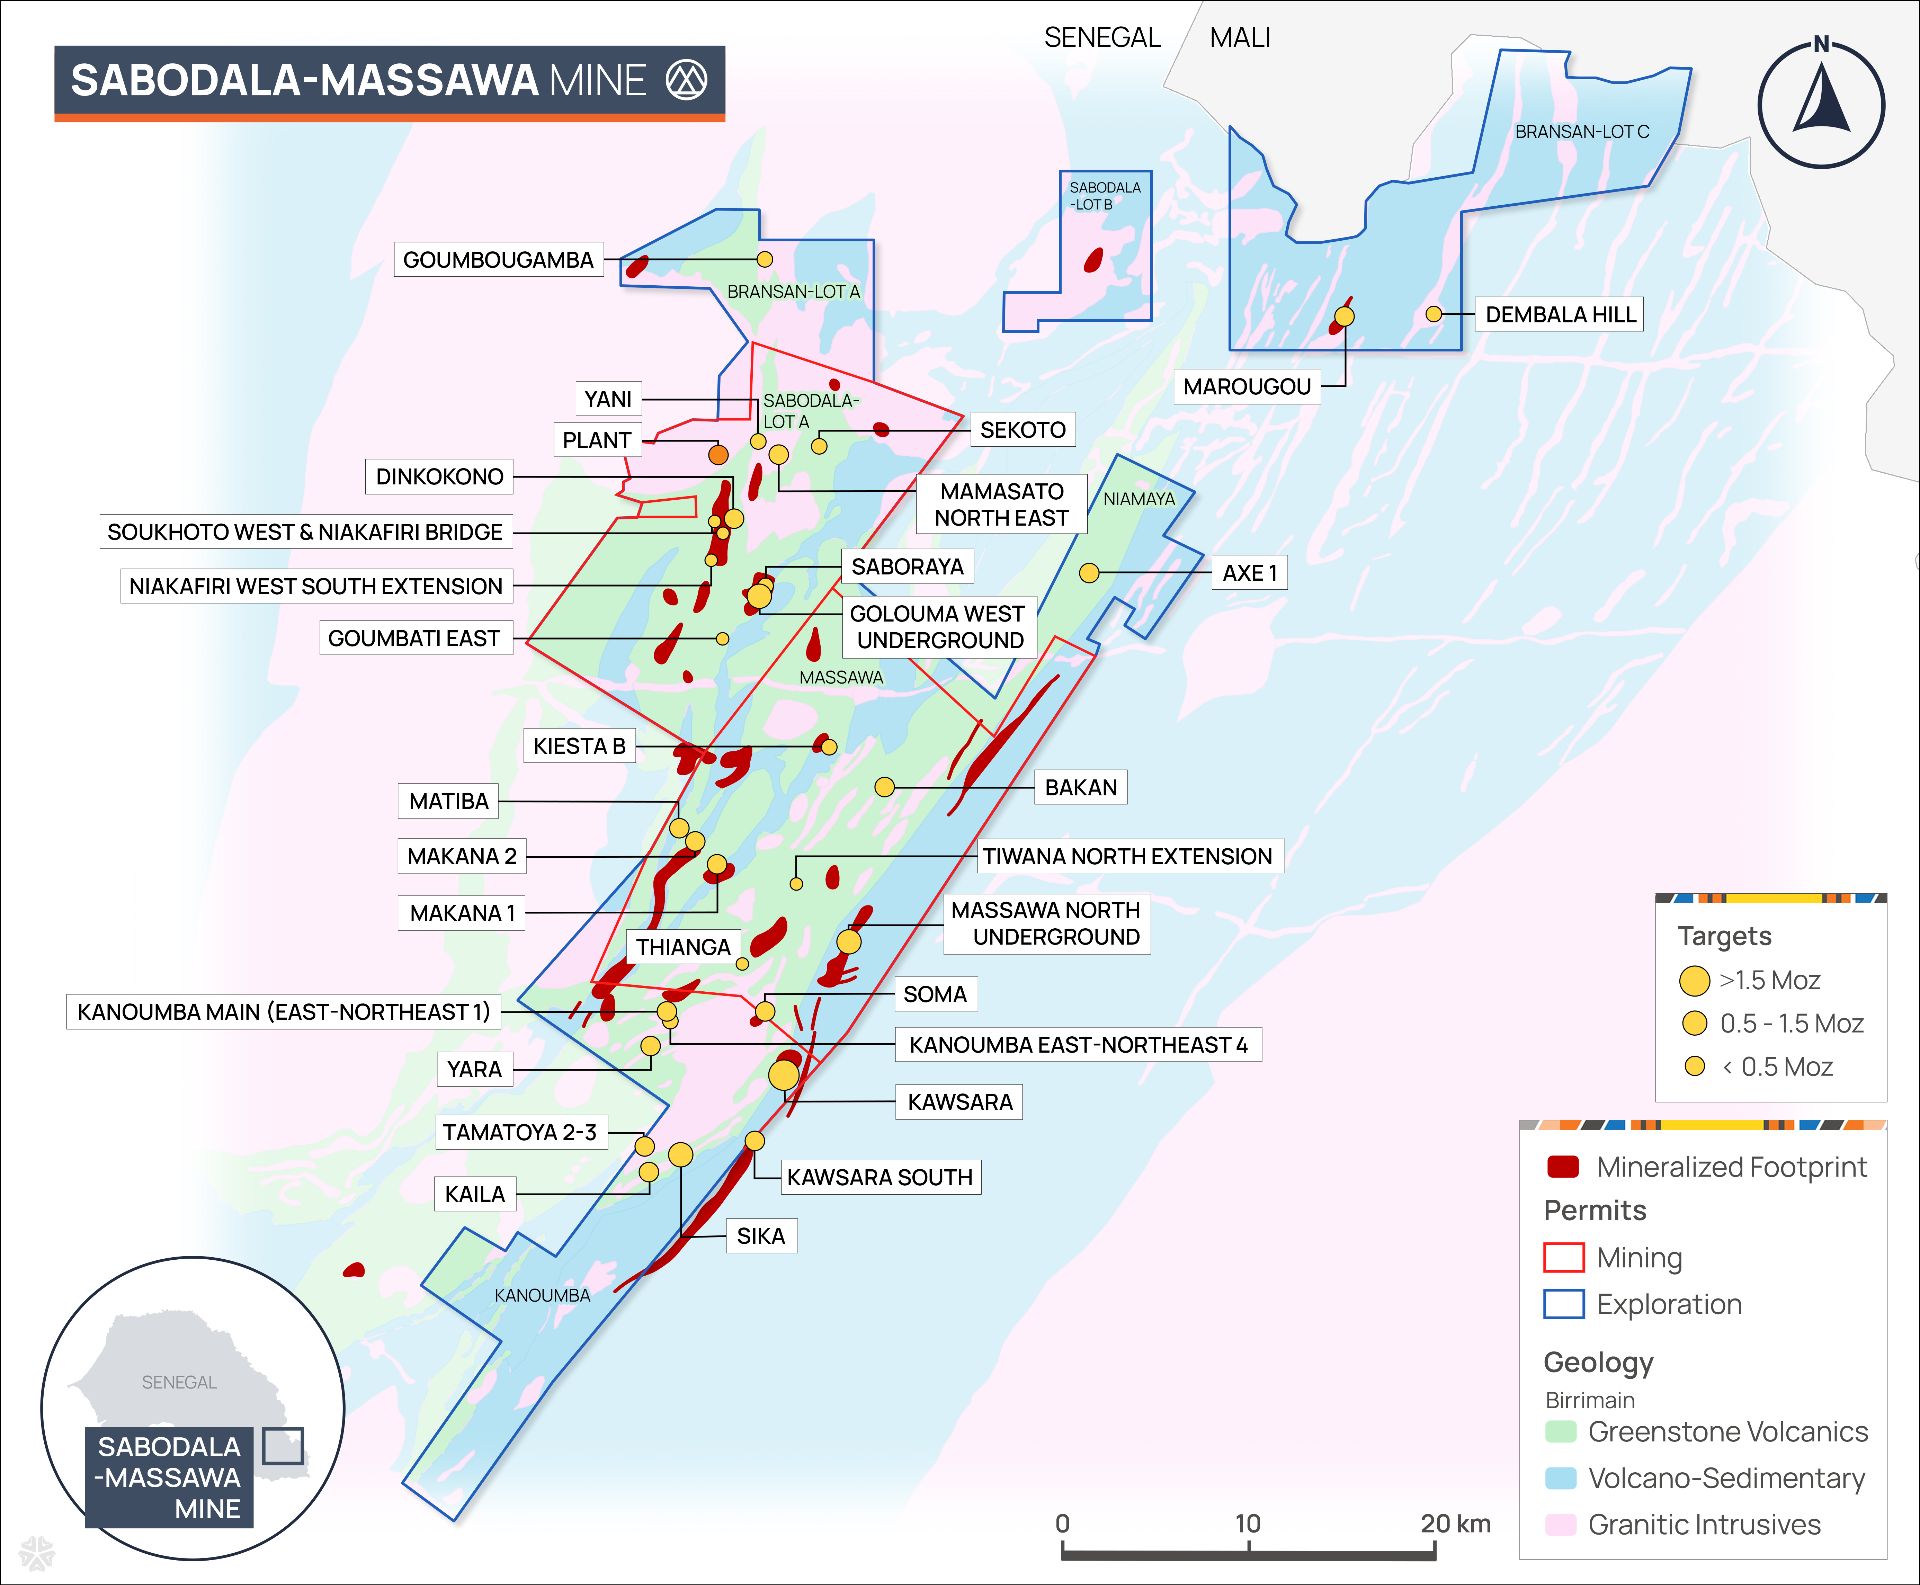
Within the vast Sabodala-Massawa property, the discovery of between 1.5 and 2.0Moz of mineral resources over the 2026 to 2030 period is targeted, prioritising targets that can support the mine plan.
Current exploration efforts are focused on the Makana and Kawsara targets, which are expected to provide non-refractory resources to support the mine plan, while the Goulouma and Kerekounda underground deposits are expected to provide high grade non-refractory ore in the medium term to bolster the grade profile in the mine plan.
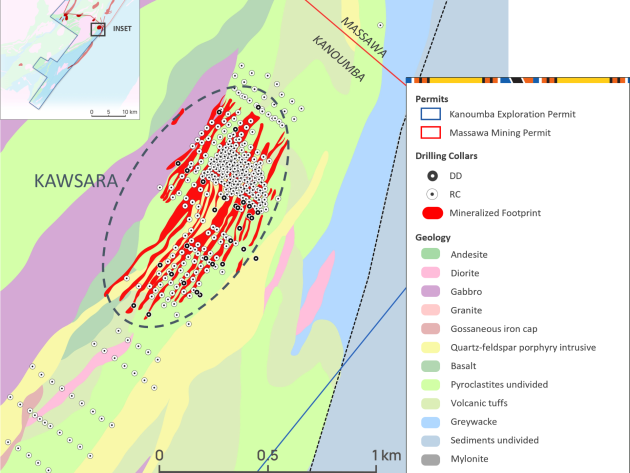
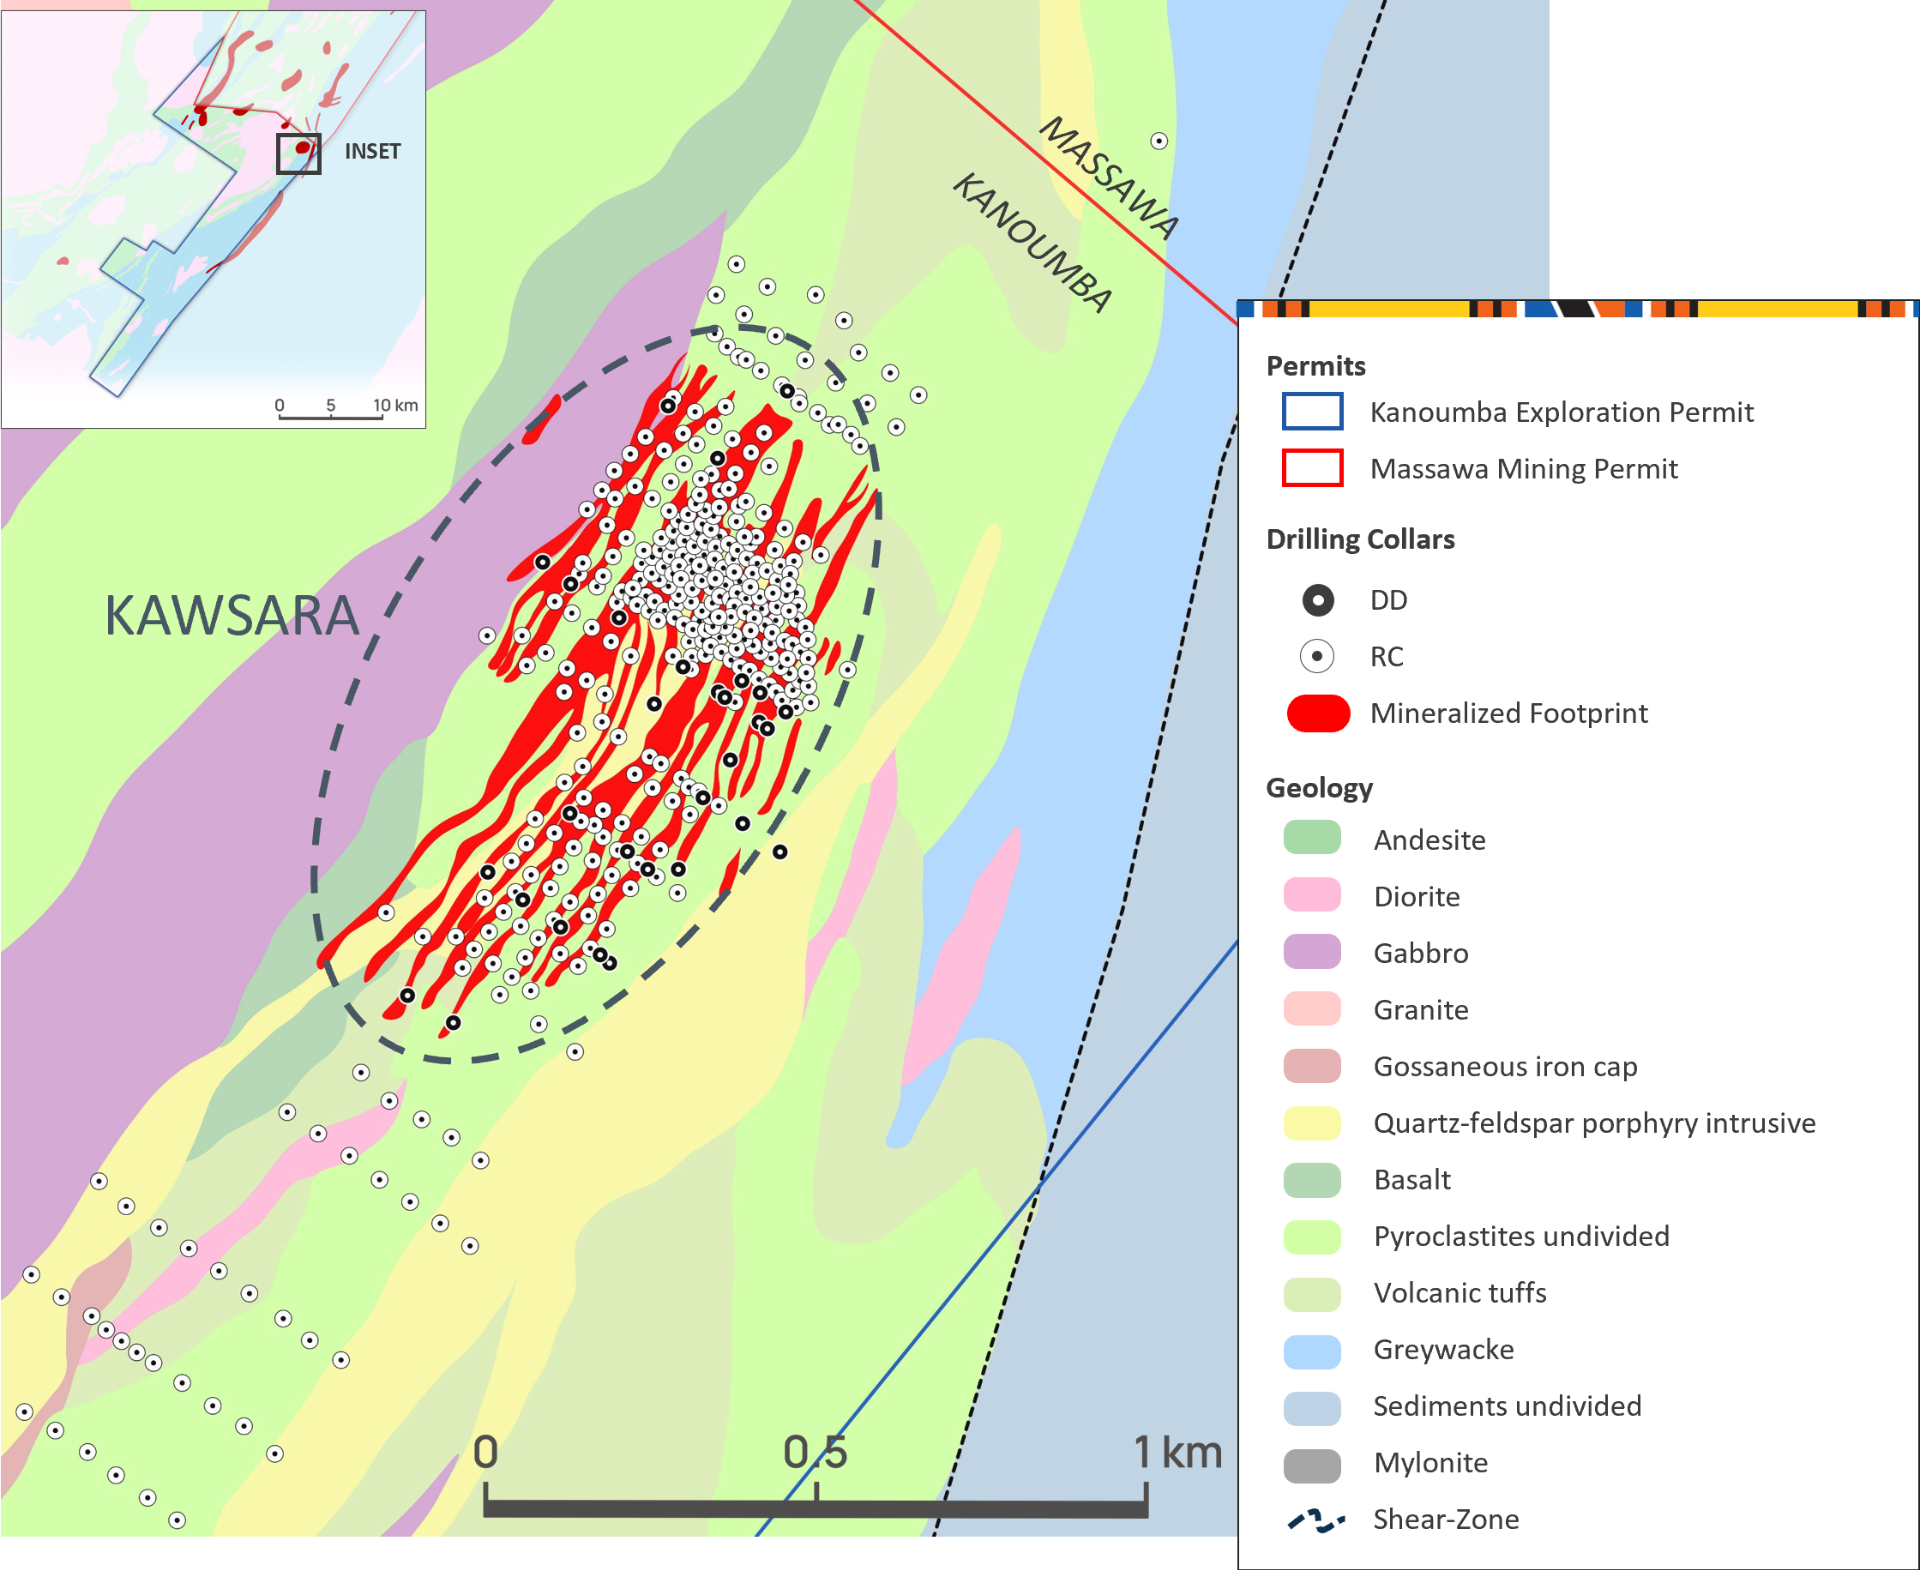
The Kawsara target
Kawsara is located southwest along the Massawa structure and is located approximately 35km southeast of the Sabodala-Massawa processing plant. Kawsara is a 10km long anomaly that includes the Tama Toya and Sira targets. The Kawsara target has the potential to provide near-term CIL ore. The anomaly was drilled in early 2024, identifying a potentially large resource with near-surface mineralisation that is >1.50g/t and continuous over the trend. Drilling at the Kawsara, Sira and Tama Toya deposits has extended mineralisation towards the southwest where the deposit remains open.
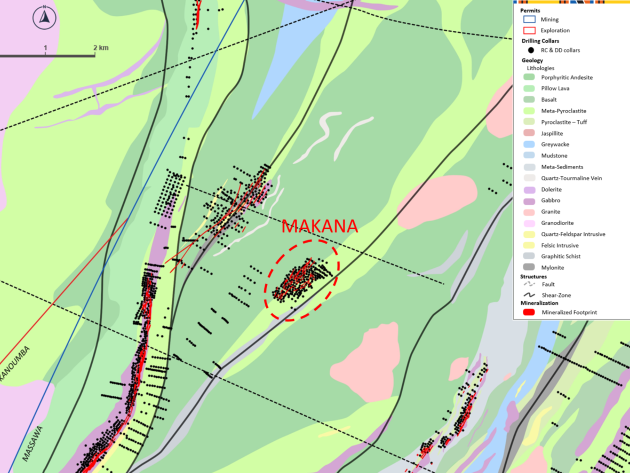
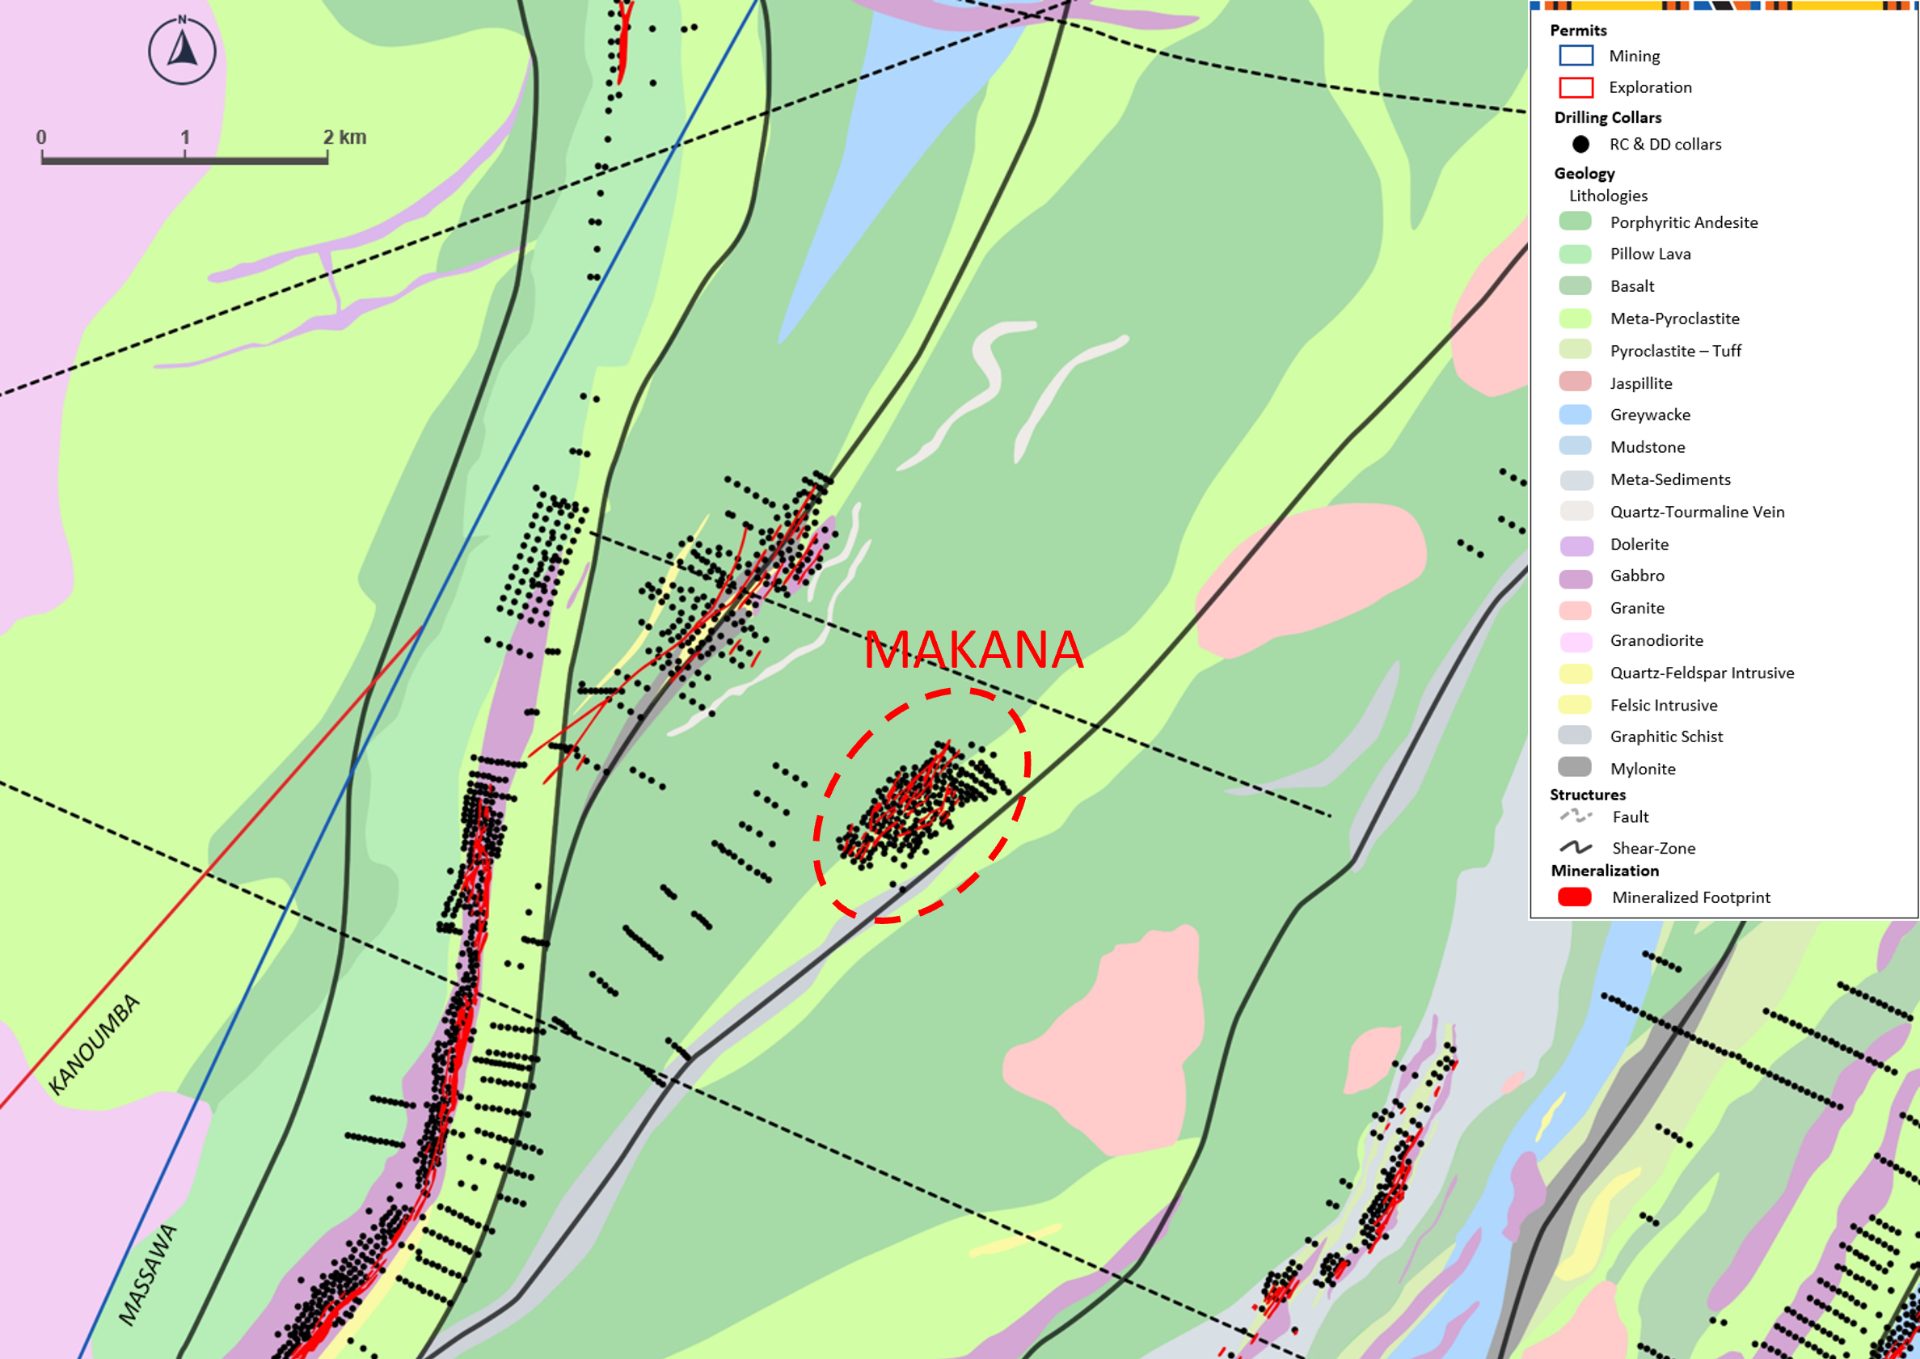
The Makana target
The Makana target is located approximately 20km from the Sabodala-Massawa processing plant and is situated on trend between the Sofia and Kiesta deposits. Makana has the potential to provide high grade CIL ore in the nearer-term, with near-surface mineralisation. Geological drilling of the Makana target is ongoing, with follow-up drilling planned for FY-2026 to expand resources further, with a resource expected to follow.
| *Operational data | FY-17 | FY-18 | FY-19 | FY-20 | FY-21 | FY-22 | FY-23 | FY-24 | FY-25 |
|---|---|---|---|---|---|---|---|---|---|
| Mining | |||||||||
| Waste - open pit (kt) | 35,385 | 35,347 | 30,977 | 28,666 | 38,647 | 42,810 | 39,738 | 37,786 | 30,355 |
| Ore mined - open pit (kt) | 2,101 | 1,921 | 2,909 | 5,286 | 7,169 | 6,449 | 6,205 | 5,692 | 4,253 |
| Processing | |||||||||
| Ore processed (kt) | 4,221 | 4,069 | 4,161 | 4,122 | 4,254 | 4,289 | 4,755 | 5,061 | 5,530 |
| Grade (g/t) | 1.87 | 2.03 | 1.98 | 1.94 | 3.11 | 2.88 | 2.15 | 1.89 | 2 |
| Recovery (%) | 92.1 | 92.3 | 90.9 | 89.4 | 90 | 89 | 89.4 | 76 | 80 |
| Production (oz) | 233,267 | 245,230 | 241,276 | 229,199 | 381,000 | 358,339 | 293,747 | 229,114 | 273,533 |
| Cash cost details | |||||||||
| Cash cost per ounce sold (US$/oz) | 721 | 660 | 690 | 765 | 506 | 577 | 688 | 1,044 | 1,092 |
| All-in sustaining costs (US$/oz) | 1,024 | 887 | 857 | 885 | 672 | 691 | 767 | 1,158 | 1,248 |
*Asset was acquired on 10 February 2021 as part of the Teranga transaction. Mining and processing data shown on a 100% basis for FY-2021, while cash cost data is shown on a consolidated basis for the post-acquisition period.
| Key metrics | FY-17 | FY-18 | FY-19 | FY-20 | FY-21 | FY-22 | FY-23 | FY-24 | FY-25 |
|---|---|---|---|---|---|---|---|---|---|
| Safety and health | |||||||||
| Fatalities | 1 | 0 | 0 | 0 | 0 | 0 | 0 | 0 | 0 |
| Lost Time Injuries | 4 | 2 | 2 | 0 | 3 | 1 | 2 | 1 | 1 |
| Energy* | |||||||||
| Energy consumption (GJ) | — | — | — | — | 2,615,759 | 2,903,614 | 2,701,543 | 3,340,440 | 2,852,007 |
| Energy intensity (GJ/oz of production) | — | — | — | — | 6.9 | 8.3 | 9.1 | 14.6 | 10.4 |
| Emissions* | |||||||||
| GHG emissions (tCO2e) | — | — | — | — | 88,262 | 107,408 | 258,483 | 161,926 | 191,669 |
| GHG emissions intensity (tCO2e/oz of production) | — | — | — | — | 0.5 | 0.6 | 1.1 | 1 | 0.7 |
| Water* | |||||||||
| Water withdrawal (ML) | — | — | — | — | 1,668 | 3,089 | 4,072 | 4,320 | 3,975 |
| Water withdrawal Intensity (ML/oz of production) | — | — | — | — | 0.004 | 0.009 | 0.013 | 0.019 | 0.015 |
| Water consumption (ML) | — | — | — | — | 638 | 1,060 | 550 | 754 | 1,448 |
*Asset acquired on 10 February 2021, data not reported by Endeavour before this date.
Presentations and technical reports
NOTE: Historical technical reports are for reference only and are not be to relied upon
| On a 100% basis. Resources shown inclusive of reserves |
Tonnage (Mt) |
Grade (Au g/t) |
Content (Au koz) |
|---|---|---|---|
| Proven reserves | 14.8 | 1.12 | 531 |
| Probable reserves | 28 | 2.48 | 2,237 |
| P&P reserves | 42.8 | 2.01 | 2,768 |
| Measured resources | 16.9 | 1.21 | 661 |
| Indicated resources | 63.1 | 2.23 | 4,529 |
| M&I resources | 80 | 2.02 | 5,190 |
| Inferred resources | 27.2 | 2.02 | 1,766 |
Current at 31 December 2025

